Basics of fatigue strength

HAIBACH has explained the basics of fatigue strength in detail, including the diagram in the figure below. In the following, this scheme will serve to explain the essential correlations of the fatigue strength. Based on the stress-strain curve of the material (a), the tensile strength Ra and the yield strength Re are to be taken as upper limit values of the stress. In the sense of the general maximum stress verification, exceeding the tensile strength once would mean failure of the component. The fatigue strength SD provides a stress value up to the level of which an oscillating stress (b) can be sustained as often as desired without fracture. A vibrational stress above the fatigue strength (c) leads to fatigue failure after a finite number of cycles, whereby the higher the stress, the earlier the failure occurs.
Relationships of fatigue strength after HAIBACH

For a vibrational stress with constant amplitudes, this dependence is represented by the fatigue strength line, the inclined part of the Wöhler line. The complete Wöhler line extends from the tensile strength via the fatigue strength line to the fatigue limit. 

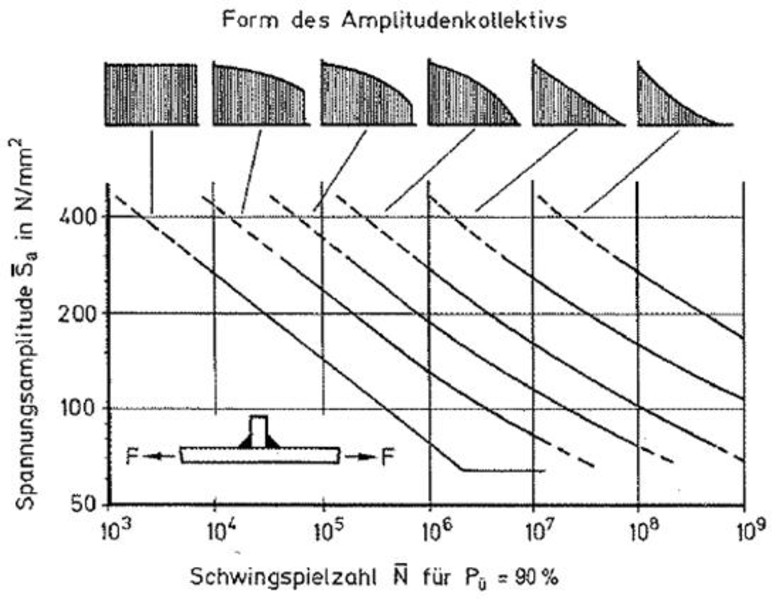
Important: If the oscilation stress on with constant amplitudes but with the same maximum value as in case (c) with a more or less random-like sequence of differently sized amplitudes (d), the tolerable number of cycles will exceed the fatigue limit line. A strain curve of this kind is for the operation of most components, including also be assessed for tower constructions of wind turbines, characteristic and the procedures of operating resistance. With the Gaßner life line it is one of the fatigue limit line corresponding dependence between the stress level and the finite lifetime, expressed in number of cycles.

The life line

The service life line can be determined by experiments or simulations of the random load sequence. However, it can also be obtained mathematically based on the WÖHLER line coupled with a damage accumulation hypothesis. This is the starting point for the previous investigations within this report.

The extent to which the service life line deviates from the WÖHLER line towards higher numbers of oscillating cycles is determined by the properties of the stress-time function under consideration. These are often given in the form of stress collectives, whereby the individual vibration cycles are classified into corresponding stress classes (collectives) by means of counting methods (e.g. Rainflow method).

Life lines for a welded connection for different forms of collective amplitude after HAIBACH

The figure on the right shows how strongly the service life of a welded component at a given stress value Sa depends on the shape of the amplitude spectrum. Under a given load of Sa=250 MPa, the service life can be between 104 and 108 cycles, depending on the shape of the amplitude spectrum. As expected, the lifetime is shorter the more complete the collective form is, i.e. the more vibratory cycles with a relatively large amplitude are included in the temporal stress curve. The service life line for the rectangular stress spectrum is the fatigue strength line from WÖHLER tests. In this respect, the WÖHLER line proves to be the lower limit case of all possible service life lines.

SKI_Logo_600px_72dpi_rgb

Copyright © 2024 

SKI Ingenieurges. mbH
Mengendamm 12
30177 Hannover

Phone: +49 (0) 511 / 261847-0

Consulting Engineers

BWE Expert Advisory Board